You likely face the daunting task of compiling a mountain of spreadsheets, compliance documents, and departmental updates at the end of every fiscal year. To make this process smoother, consider using expert annual report design services. The sheer volume of information feels overwhelming and raw data does not constitute a compelling story.
Research shows that only about 33% of annual report readers are investors or analysts actively seeking the insights you aim to convey, with the rest comprising employees, customers, and other stakeholders who also value clarity and structure in reporting. Investors lack the time to wade through 150 pages of dense text to discover your value proposition.
At Scribblers India, we have been solving this problem regularly for our clients. We handle massive unorganized data dumps and refine it into a sharp and strategic 40-page document. You will learn the exact process we use to filter, narrate, and design this report. You can apply these strategies to your next project using professional annual report writing and designing services.

How Do We Start the Annual Report Planning Process?
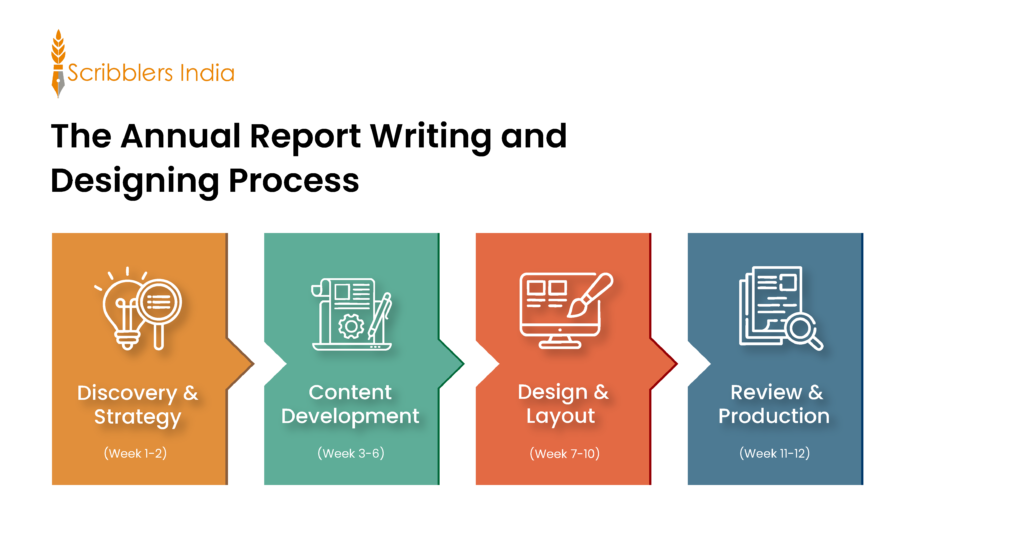
You must establish a clear theme and goals before starting the annual report writing and designing process. We convene strategy sessions with key stakeholders to define the narrative arc. This aligns financial data with corporate vision. Creating a pagination flat plan ensures the document stays concise and focused on the objectives of annual report design services.
- The Strategy Session: You cannot create a cohesive document without a central theme. We sit down with the leadership team to define the narrative for the year. We ask if it was a year of aggressive growth, resilience, or innovation. This theme dictates every design choice we make in our annual report design services.
- Stakeholder Alignment: We gather inputs from the CFO, CEO, and marketing teams early in the process. Misalignment leads to endless revisions later. You must ensure everyone agrees on the key messages before writing a single word. This step is critical for effective annual report design services.
- The Pagination Flat Plan: We create a page-by-page skeleton to ensure we stuck to the 40-page limit. You need to assign specific content to every page number. This prevents content creep and ensures the final annual report design services output remains tight and impactful.
- Page 1-5: Leadership Messages
- Page 6-15: Strategic Highlights
- Page 16-30: Financial Review
- Page 31-40: Governance and ESG
A manufacturing client needed to shift focus from production volume to sustainability. We used the planning phase to map a Green Future theme. We ensured every page from the Chairman’s letter to the financial review reinforced their commitment to eco-friendly practices, giving the annual report design services team a clear direction.
How Do We Filter 150 Pages of Company Data for Relevance?
You face the challenge of distinguishing operational noise from strategic insight. We use a step-by-step process featuring a filtering matrix to categorize information into mandatory compliance, strategic wins, and non-essential fluff. This method prioritizes future-facing data over historical minutiae to create a concise investor ready annual report.
- The Filtering Matrix: You likely have too much information. Most of it represents operational noise rather than strategic insight. We categorize data into Must-Have compliance items, Should-Have strategic wins, and Nice-to-Have fluff. Our annual report design services rely on this matrix to reduce bulk.
- Focus on the Future: Investors care about where you are going rather than just where you have been. We prioritize data that signaled future growth. Annual report design services must highlight forward-looking statements to build confidence among stakeholders.
- Killing the Darlings: We make hard decisions to cut lengthy departmental updates. You might feel attached to every project detail. However, if it does not serve the core narrative or annual report design services goals, it must go.
- Exclude: Routine operational updates.
- Include: Milestones affecting revenue.
- Exclude: Generic team photos.
- Include: Strategic leadership insights.
A fintech company handed us 200 pages of operational logs. We filtered out daily transaction reports and kept only the quarterly growth milestones. This reduced the page count by 60% while highlighting the strategic pivot to AI-driven services that investors actually cared about in the final report.
How Do We Turn Raw Numbers Into Compelling Stories?
Numbers require context to resonate with stakeholders. We employ data storytelling for business techniques to connect raw statistics with real-world value creation. This involves humanizing data through testimonials and ensuring a unified corporate voice replaces disjointed departmental inputs.
- The Narrative Arc: Numbers alone appear dry. We need to contextualize them to show value, for instance, we connect a rise in R&D spending to a story about a new product launch. Annual report design services excel when they bridge the gap between spreadsheets and real-world impact.
- Humanizing the Data: We add employee quotes and customer success stories to back up the statistics. You need to show the people behind the profits. This approach is a staple of modern annual report design services and creates an emotional connection with the reader.
- Consistent Tone: You need a single voice throughout the document. We rewrite disjointed inputs from different departments into a unified, professional corporate voice. High-quality annual report design services ensure the CEO sounds consistent with the marketing team.
- Before: We increased efficiency by 10%.
- After: Our new automation strategy drove a 10% efficiency gain, allowing us to serve more clients.
- Impact: Investors understand the why behind the number.st
We worked with a healthcare provider who had strong revenue but low patient trust scores. We rewrote their dry clinical statistics into patient success stories. This approach transformed cold numbers into a narrative of care, significantly improving stakeholder sentiment during the AGM using our annual report design services.
Why Is Data Visualization Critical for Investor Engagement With Annual Reports?
A well-designed chart conveys trends faster than text. We transform complex financial tables into clean bar charts and infographics that explain business models instantly. Our annual report design services rely on visual efficiency to ensure stakeholders grasp key performance indicators without fatigue.
- Visual Efficiency: A chart conveys a trend faster than a paragraph. You want investors to grasp the point immediately. Our team turns complex Excel tables of five-year financial highlights into clean charts and diagrams. This is where annual report design services add immense value.
- Infographics Over Text: We use infographics to explain the business model instead of writing three pages of text. You save space and increase comprehension simultaneously. Annual report design services use visual content to simplify complex corporate reporting trends.
- Brand Alignment: We ensure the charts used corporate colors and fonts to look professional. You cannot rely on default Excel styles. Professional annual report design services ensure every visual element aligns with your brand identity.
- Use Bar Charts: For comparing growth over time.
- Use Pie Charts: For market share breakdown.
- Use Icons: To represent service areas quickly.
- Use Callouts: To highlight key percentages.
A logistics firm wanted to explain their complex supply chain. Instead of five pages of text, we designed a single double-page spread infographic. This visual approach allowed investors to understand their global reach and efficiency improvements in under thirty seconds, proving the value of expert annual report design services.
How Do We Design an Annual Report Layout That Investors Actually Read?
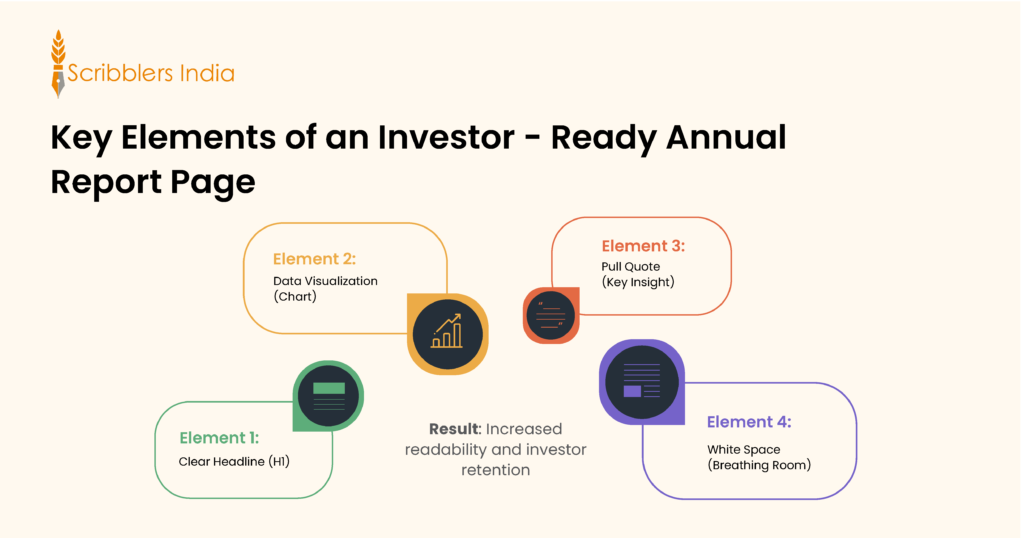
You must prioritize white space and clear hierarchy to aid skimming. We use headings, pull quotes, and authentic photography to guide readers through the narrative. An effective annual report structure ensures navigation is intuitive, so investors find financial statements quickly.
You cannot clutter the page. Our annual report design services prioritize breathing room to prevent reader fatigue.
- Utilize White Space: We use generous margins to make the report feel premium and readable during long review sessions.
- Establish Visual Hierarchy: We use clear headings and pull quotes to guide the skimming reader to key insights.
- Use Authentic Photography: We replace stock photos with authentic shots of the leadership and facilities to build trust.
- Improve Navigation: We add color-coding or tabs to help investors find sections like “Financials” quickly.
An energy company previously used dense walls of text that investors ignored. We redesigned the layout with wide margins and bold pull quotes. Feedback from their investor relations team confirmed that stakeholders finally engaged with the key strategic risks section during the earnings call, thanks to our professional annual report design services.

What are the Final Checks for an Investor-Ready Annual Report?
You cannot afford typos or compliance errors in financial documents. We conduct multiple rounds of professional editing and regulatory checks. The final output includes print-ready PDFs and an interactive annual report format to maximize accessibility and impact for shareholders.
- Proofreading and Editing: One typo can ruin credibility. We undertake three rounds of professional editing. You must include rigorous quality control to ensure perfection in every sentence.
- Compliance Check: We ensure all mandatory regulatory disclosures were present and accurate. You cannot compromise on legal requirements. Our annual report design team verifies that the report meets all statutory standards.
- Format Outputs: We deliver the report in a print-ready PDF and a digital-friendly version. You need to cater to both traditional and digital audiences. Modern annual report design services often include microsites or interactive elements as well.
A retail giant nearly printed a report with a typo in the net profit figure. Our rigorous three-stage proofreading process caught the error before production. We also converted the final file into an interactive microsite, doubling the readership among younger retail investors who preferred digital annual report design services.
Design a Compliant Annual Report with Scribblers India
To develop a compelling annual report, you need a specialized partner who understands investor psychology, regulatory standards, and the art of corporate storytelling.
Here is why partnering with Scribblers India can work wonders for your annual report designing process:
- Expert Narrative Structuring: We transform dry financial data into a cohesive story that resonates with shareholders and stakeholders through our annual report design services.
- Regulatory Compliance Knowledge: Our team ensures your report complies with all applicable legal guidelines and disclosure requirements, without errors.
- Data Visualization Mastery: As an experienced annual report designing agency, we turn complex spreadsheets into clear, impactful infographics that make financial trends instantly understandable.
- Investor-Centric Design: We craft layouts specifically designed for how investors read, prioritizing clarity, hierarchy, and professional aesthetics.
- End-to-End Management: From the initial concept and copywriting to the final print and digital distribution, our annual report design services handle everything.
Ready to transform your raw data into a powerful tool for investor confidence? Contact us today and let us design an annual report that truly reflects your company’s values.
Frequently Asked Questions (FAQs)
How long does it take to design an annual report?
The timeline typically ranges from 6 to 12 weeks. This depends on the complexity of the data, the speed of internal approvals, and whether you require original photography or extensive annual report design services.
What is the difference between an integrated report and an annual report?
An annual report focuses primarily on financial performance and statutory compliance. An integrated report combines financial data with non-financial metrics like ESG, strategy, and governance to show how the company creates value over time.
Do you write the content or just design the annual report?
We provide a comprehensive solution. Our team includes financial writers who craft the narrative, CEO letters, and management discussion and analysis, working alongside designers to ensure the text and visuals align perfectly within our annual report design services.
How much does professional annual report design cost?
Costs vary based on page count, illustration requirements, and whether you need a digital version. We offer customized packages tailored to your specific needs, ensuring you get a premium investor ready annual report within budget.
Can you convert our printed report into a digital format?
Yes. We specialize in creating interactive PDFs and microsites. These digital formats allow you to reach a wider audience, track engagement, and present video content or animated charts that print cannot offer.